STAT 200 Week 4 Homework Problems Study guides, Class notes & Summaries
Looking for the best study guides, study notes and summaries about STAT 200 Week 4 Homework Problems? On this page you'll find 88 study documents about STAT 200 Week 4 Homework Problems.
Page 3 out of 88 results
Sort by
-
University of Maryland - STAT 200; Week 7 Homework Problems, Already Graded A.
- Exam (elaborations) • 8 pages • 2021
- $10.99
- + learn more
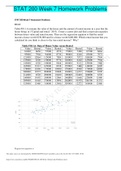
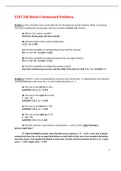
University of Maryland - STAT 200 Week 7 Homework Problems. THE TABLE FOR EACH QUESTION PLUST THE FULL QUESTIONS CAN BE FOUND IN THE ATTATCHMENT!!!!!!!! 1 table #10.1.6 contains the value of the house and the amount of rental income in a year that the house brings in ("Capital and rental," 2013). Create a scatter plot and find a regression equation between house value and rental income. Then use the regression equation to find the rental income a house worth $230,000 and for a house worth $400...
-
HESI RN EXIT EXAM COMPREHENS IVE V2-2021 ACTUAL EXAM
- Exam (elaborations) • 41 pages • 2023
- $14.29
- + learn more
HESI RN EXIT EXAM COMPREHENS IVE V2-2021 ACTUAL EXAM 1. The school nurse is preparing a presentation for an elementary school teacher to inform them about when a child should be referred to the school clinic for further follow-up. The teachers should be instructed to report which situations to the school nurse? (Select all that apply) a. Refuses to complete written homework assignments b. Thirst and frequent requests for bathroom breaks c. Bruises on both knees after the weekend 2....
-
STAT 200 Week 1 to week 7
- Package deal • 7 items • 2022
- $40.49
- + learn more
STAT 200 Week 7 Homework Problems Exam (elaborations) STAT 200 Week 5 Homework Problems Exam (elaborations) STAT 200 Week 2 Homework Problems Exam (elaborations) STAT 200 Week 4 Homework Problems Exam (elaborations) STAT 200 Week 6 Homework Problems. Exam (elaborations) STAT 200 Assignment #3: Inferential Statistics Analysis and Writeup
-
STAT 200 Week 4 Homework Problems
- Exam (elaborations) • 6 pages • 2021
- $12.49
- 1x sold
- + learn more
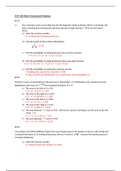
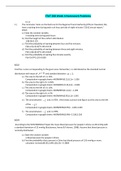
STAT 200 Week 4 Homework Problems 6.1.2 The commuter trains on the Red Line for the Regional Transit Authority (RTA) in Cleveland, OH, have a waiting time during peak rush hour periods of eight minutes ("2012 annual report," 2012). State the random variable. X = waiting time between peak hours Find the height of this uniform distribution. 1/(8-0) = 0.125 Find the probability of waiting between four and five minutes. ...
-
STAT 200 Week 4 Homework Problems
- Exam (elaborations) • 5 pages • 2021
- $12.99
- + learn more
STAT 200 Week 4 Homework Problems 6.1.2 ⦁ The commuter trains on the Red Line for the Regional Transit Authority (RTA) in Cleveland, OH, have a waiting time during peak rush hour periods of eight minutes ("2012 annual report," 2012). ⦁ State the random variable. X=The waiting time of the trains on the Red Line ⦁ Find the height of this uniform distribution. F(x)= 1/8-0 = 0.125 ⦁ Find the probability of waiting between four and five minutes. P(4<X<5)= (5-4)*0.125 = 0.125 ⦁ Find ...


-
STAT 200 Week 4 Homework Problems / STAT200 Week 4 Homework Problems
- Exam (elaborations) • 6 pages • 2021
- $8.99
- + learn more
STAT 200 Week 4 Homework Problems / STAT200 Week 4 Homework Problems
-
University of Maryland - STAT 200; Week 7 Homework Problems, Already Graded A.
- Exam (elaborations) • 13 pages • 2020
- $12.99
- 4x sold
- + learn more
University of Maryland - STAT 200 Week 7 Homework Problems. THE TABLE FOR EACH QUESTION PLUST THE FULL QUESTIONS CAN BE FOUND IN THE ATTATCHMENT!!!!!!!! 1 table #10.1.6 contains the value of the house and the amount of rental income in a year that the house brings in ("Capital and rental," 2013). Create a scatter plot and find a regression equation between house value and rental income. Then use the regression equation to find the rental income a house worth $230,000 and for a house worth $400,0...

-
STAT 200 Week 4 Homework Problems / STAT200 Week 4 Homework Problems | 100% Correct, Already Graded A | Rated 100%
- Exam (elaborations) • 6 pages • 2021
- $8.49
- + learn more
STAT 200 Week 4 Homework Problems / STAT200 Week 4 Homework Problems | 100% Correct, Already Graded A | Rated 100%
-
STAT 200 Week 2 Homework Problems
- Exam (elaborations) • 8 pages • 2022
- $12.98
- + learn more
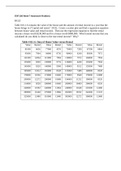
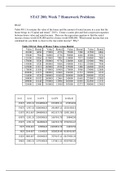
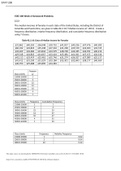
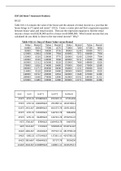
STAT 200 Week 2 Homework Problems 2.2.2 The median incomes of females in each state of the United States, including the District of Columbia and Puerto Rico, are given in table #2.2.10 ("Median income of," 2013). Create a frequency distribution, relative frequency distribution, and cumulative frequency distribution using 7 classes. Table #2.2.10: Data of Median Income for Females $31,862 $40,550 $36,048 $30,752 $41,817 $40,236 $47,476 $40,500 $60,332 $33,823 $35,438 $37,242 $31,238 $39...
-
University of Maryland - STAT 200; Week 7 Homework Problems, Already Graded A.
- Exam (elaborations) • 13 pages • 2022
- $14.49
- + learn more
STAT 200 Week 7 Homework Problems 10.1.2 Table #10.1.6 contains the value of the house and the amount of rental income in a year that the house brings in (“Capital and rental,” 2013). Create a scatter plot and find a regression equation between house value and rental income. Then use the regression equation to find the rental income a house worth $230,000 and for a house worth $400,000. Which rental income that you calculated do you think is closer to the true rental income? Why? Tabl...
